Sign up for our free daily newsletter
Get the latest news and some fun stuff
in your inbox every day
Get the latest news and some fun stuff
in your inbox every day
Johnson & Johnson was established in 1886 when the Johnson brothers created a line of ready to use surgical dressings. It listed in 1944 and within that period until now, managed a run of 52 consecutive years of dividend increases. Today it operates over 275 companies around the world, 144 manufacturing plants occupying 21.7 million square feet of floor space and has a market cap of $277bn. The company is broken up into 3 business segments, namely Consumer, Pharma and Medical Devices and Diagnostics.
Last week we received first quarter results for 2015 from JNJ which slightly beat expectations. Remember that this multinational business has serious currency headwinds because it reports in dollars but sells products all over the world. Sales came in at $17.37bn which is down 4.1% from last year but if you exclude those currency movements it represents organic growth of 5.7%. In dollars, US sales increased 5.9% whilst international sales decreased 12.4%. Earnings per share came in at $1.56 which was 2c above consensus. EPS growth ex currency movements came in at 3.7%.
To get a good feel of their sales mix I have hacked a table from the presentation which shows you sales by divisions as well as splitting each division between U.S sales and international.
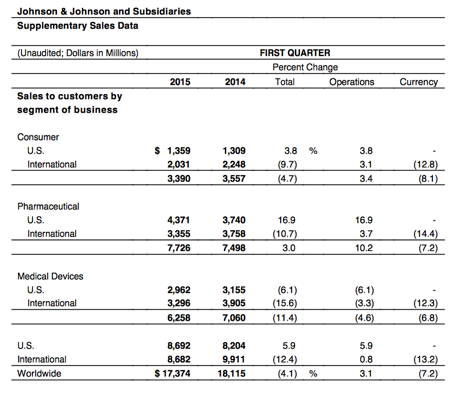
As you can see, the US is doing well while the international business is suffering from currency movements. Because of the growth in the US and the slow down internationally the split in sales is now almost exactly 50-50. As I have said before, currency swings happen, long term investment decisions should not be based on these swings. Sometimes they work for you, sometimes against. The US dollar is strengthening because the US economy is strong. If you gave companies a choice they would certainly take a strong US economy and strong dollar over a weak economy with a weak dollar.
Amongst the divisions, pharma is clearly the dominant sales and growth driver. That is a trend we have seen throughout the whole healthcare sector for a while now. If you had invested in a pure pharma business it would have outperformed JNJ. But these businesses go through cycles and we like the diversification. I read an analyst report which has a price target of $108 ( currently $100) for JNJ. They value the pharma business at $59 a share, the devices business at $36 and the consumer business at $12 a share. It's like investing in an index. The slower growing divisions have less influence over time.
Within the Pharma business there are lots of moving parts. Products coming off patent, others awaiting FDA approval. This is strategically and very well managed by management. Of the $17.374bn in sales for the quarter, they invested $1.9bn in research and development. You can be assured that they are on top of things. If you would like to take a closer look at their brands within the divisions go to the report here and scroll to the bottom, the last 6 pages give you all the details. JNJ Q1 2015
Fundamentally the stock trades in line with the market. Earnings for the year are expected to come in at $6.14. Trading at $99.58 it attracts a forward PE rating of 16.2 and a solid yield of 3%. It has about $5bn more in cash than debt and is sitting pretty financially. Earnings growth for 2015 is expected to come in at 5%.
Our thesis is that the healthcare sector globally will grow even faster than market expectations, JNJ is a solid entry into the sector. It won't blow the lights out, that is why we also like Cerner and Stryker, but you will get solid growth amongst all the divisions they operate in. And don't forget the room for innovation in the sector. It's the big players like this, with massive balance sheets who can change the face of healthcare. For example JNJ are partnering with Google to improve robot surgery. We continue to add JNJ as a core holding in our US portfolio's.